Dependencies
Setup
|
Download Dependencies Setup |
GISToolkit Editor |
License Information
The GISToolkit uses the LGPL
license .
The GISToolkit can be downloaded from Source Forge.
What Does it Do:
There are some simple things it can do, like
displaying data. Here is a display of the States layer. The
data for this layer is privided by the USGS (United States Geological
Service) in a Shape file format. Several data sources are available in
the GISToolkit, and more can be added.
Current data sources are:
DB2 Spatial Extender (Registered Trademark of IBM)
ESRI SDE (Trademark of Environmental Systems
Research Institute)
Terraserver (Trademark of Microsoft)
1.0.0 OGC Web Map Services
ESRI Shapefiles
POSTGIS database.
This data is provided in a shape file in WGS84 Latitude Longitude
projection, and it is presented here non projected..
Projections can be a problem, and there are currently only three available in the GISToolkit. They are
UTM, in all the zones,
Albers Equal Area,
and Lambert Connic Conformal.
These three projections are the ones that are commonly
used for State Plane layers, and for presentation. Additional
Projections can be added to the GISToolkit with little problem.
They must be able to project forward, and backward. Here is the
same map projected to UTM Zone 14.
Pretty radical difference. The projections can be accessed from
the Options menu, and the parameters can be entered there. I will
not show you the Lambert Conic Conformal Projection, it looks similar.
Multiple Layers can be displayed with different fills, lines, and
shades. This is a close up of Colorado with it's counties, still
projected to UTM Zone 14. This is not the correct zone for this
state, but it illustrates how projections can affect things. Some simple
labeling is available as well.
Shading is available on a shape file basis, or based on the contents of a column in the attribute data. Additional shaders can be easilly added. The architecture of the GISToolkit puts a heavy emphasis on expandability. Additional Labelers can be added as well. The current labeler only labels at the center of the Minimum Bounding Rectangle (MBR).
If it is desired to drill down even more than this, there is the
ability to view only Jackson county. Here the cities have been
displayed and labeled.
Zooming in a little more to the Columbine area, we are starting to
get into the range where Imagery is feasable to display. Here is
an example.
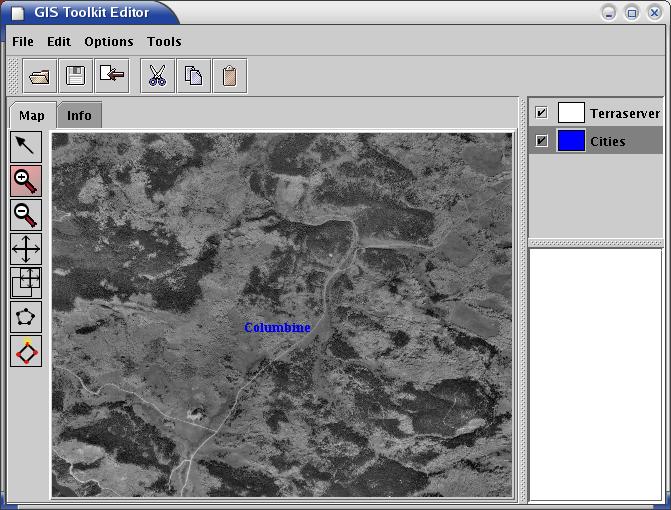
The imagery in this example is alpha blended with the map. Any
layers can be displayed above the imagery, including roads, rivers, and
cities. Alpha blending is optional. The resolutions of
imagery are those available from Terraserver, and are a subset of
64,32,16,8,4,2 and 1 meter. Displayed here is four meter
imagery. One can get themselves in trouble with imagery rather
quickly. You can select the resolution you wish to view, and the
GISToolkit will project that imagery to your projection of choice, or
you can let the GISToolkit take a rather primative guess at what would
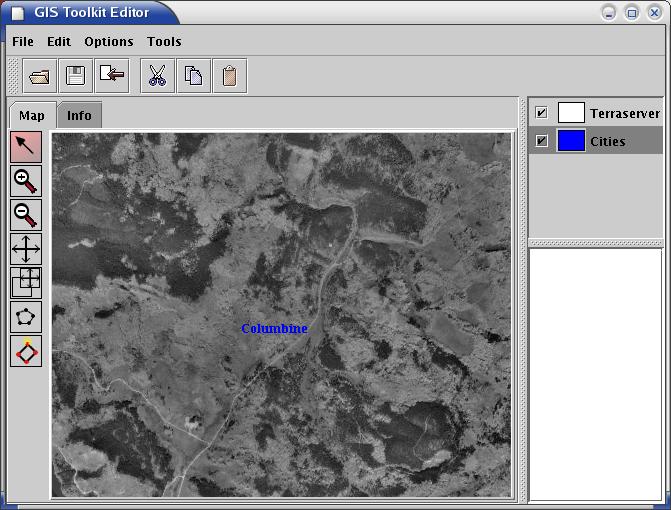
look good and project that. Terraserver data is projected in UTM
Zones, so these are the projections that look the best. The image
above is unprojected, this is the same data projected to UTM Zone 14,
and it can also be projected to Lambert Conic Conformal.
That is a quick tour of the functionality of the GISToolkit, there
are many more details under the covers, and much more opportunity for
expansion and refinement.
This is an interesting shot of the Average temperature of the US in
Albers Equal Area. This data is provided by the US National
Drought Mitigation Center, many thanks.